Uploaded image for project: 'ZABBIX BUGS AND ISSUES'
  1. ZABBIX BUGS AND ISSUES
  2. ZBX-25154

Even if you are not using "Service Monitoring", the memory usage of the "service manager" process increases when a trigger event occurs.

    • Icon: Problem report Problem report
    • Resolution: Fixed
    • Icon: Blocker Blocker
    • 6.0.34rc1, 7.0.4rc1, 7.2.0alpha1
    • 6.0.33
    • Server (S)
    • None
    • AlmaLinux release 8.9 (Midnight Oncilla)
      zabbix_server (Zabbix) 6.0.17(I confirmed that memory has increased even in 6.0.33.)
      postgres (PostgreSQL) 13.14
    • S24-W36/37, S24-W38/39
    • 2

      Steps to reproduce:

      1. Please set up Zabbix6.0 according to the following document.
        https://www.zabbix.com/download?zabbix=6.0&os_distribution=alma_linux&os_version=8&components=server_frontend_agent&db=pgsql&ws=apache
        Note

        The verification was done with postgresql, but a similar problem occurred with mysql as well.


      2. Set the following item.
        log[/var/log/messages,"(err)|(recover)"]


      3. Set the following trigger.
        Expression
         find(/Zabbix server/log[/var/log/messages,"(err)|(recover)"],,"regexp","err")=1
        PROBLEM event generation mode
         Multiple  


      4. generate a large number of trigger events
        • example)Output a large amount of target keywords to the log using the “logger” command
          $ for i in {1..500000};do logger "errorA $i" ;done
          
          Note

          rsyslog may freeze so you have to run "systemctl restart rsyslog" every time

      Result:
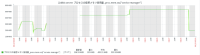
      The vsz value output by the following command will increase.

      ps -eo vsz,comm,euser,args


      It seems that recovering the trigger event does not free the memory.

      • graph
      • log
        zabbix_server.log(trace log)

        32296:20240814:135204.742 problem events : 484875 (670849 slots)
        32296:20240814:135217.276 problem events : 484879 (670849 slots)
        32296:20240814:135229.750 problem events : 484883 (670849 slots)
        32296:20240814:155214.091 problem events : 866277 (1509427 slots)
        32296:20240814:163337.834 problem events : 0 (1509427 slots)  ←Slots do not decrease even after event recovery
        32296:20240814:163342.860 problem events : 0 (1509427 slots)
        32296:20240814:163347.876 problem events : 0 (1509427 slots)
        32296:20240814:163352.907 problem events : 0 (1509427 slots)
        32296:20240814:175004.716 problem events : 0 (1509427 slots)
        32296:20240814:174530.551 problem events : 239796 (1509427 slots) ←Even if an event occurs, the slot will not increase by the amount that can be covered by the increase slot.
        32296:20240814:174537.471 problem events : 239796 (1509427 slots)
        797268:20240816:163354.922 problem events : 233774 (298153 slots) ←It is released once when the service is restarted, but if there are many events, it will be loaded immediately after startup, so it will increase quickly.
        797268:20240816:163401.682 problem events : 233777 (298153 slots)
        797268:20240816:171640.382 problem events : 437874 (670849 slots)
        1207:20240823:175048.334 problem events : 1354135 (2264149 slots)
        1207:20240823:175048.334 problem events : 1354135 (2264149 slots)
        400721:20240823:183049.364 problem events : 1354135 (2264149 slots) ←Service resumed. Same as above.
        401478:20240823:183600.106 problem events : 1354135 (2264149 slots)
        401860:20240823:184246.547 problem events : 1354135 (2264149 slots)
        401860:20240827:160522.204 problem events : 1354144 (2264149 slots)
        401860:20240827:161302.397 problem events : 1 (2264149 slots)
        401860:20240827:181853.195 problem events : 1 (2264149 slots)
        401860:20240828:175200.411 problem events : 3 (2264149 slots)
        670438:20240828:175519.163 problem events : 3 (1009 slots) ←Service resumed. Since there are few events, the number of slots will not increase.

        1. problem_event_count.png
          problem_event_count.png
          221 kB
        2. proc.mem_rss&vsize.png
          proc.mem_rss&vsize.png
          286 kB
        3. ps_command_vsz&rss.png
          ps_command_vsz&rss.png
          288 kB
        4. servicemanager_vsz_graph.png
          servicemanager_vsz_graph.png
          243 kB
        5. smem_command_pss&uss&rss.png
          smem_command_pss&uss&rss.png
          318 kB
        6. zbx25154_graph_sample.png
          zbx25154_graph_sample.png
          350 kB
        7. zbx25154_host.png
          zbx25154_host.png
          417 kB
        8. zbx25154_item.png
          zbx25154_item.png
          391 kB
        9. zbx25154_trigger.png
          zbx25154_trigger.png
          425 kB

          [ZBX-25154] Even if you are not using "Service Monitoring", the memory usage of the "service manager" process increases when a trigger event occurs.

          Vladislavs Sokurenko added a comment - - edited

          Could you please be so kind and check pss instead of vsz ? Are there unique tags used for triggers or string pool could help ?

          Vladislavs Sokurenko added a comment - - edited Could you please be so kind and check pss instead of vsz ? Are there unique tags used for triggers or string pool could help ?

          Could you please be so kind and check pss instead of vsz ?

          I will also try to get pss. Please wait for a moment.

          Are there unique tags used for triggers or string pool could help ?

          I don't use trigger tags.

          Itsuki Karimata added a comment - Could you please be so kind and check pss instead of vsz ? I will also try to get pss. Please wait for a moment. Are there unique tags used for triggers or string pool could help ? I don't use trigger tags.

          vso do you mean rss?
          pss is not something we can check with ps or with the proc.mem item in Zabbix (https://www.zabbix.com/documentation/6.0/en/manual/appendix/items/proc_mem_notes#linux)

          Sander Grendelman added a comment - vso do you mean rss? pss is not something we can check with ps or with the proc.mem item in Zabbix ( https://www.zabbix.com/documentation/6.0/en/manual/appendix/items/proc_mem_notes#linux )

          Itsuki Karimata added a comment - - edited

          It is assumed to be obtained using userparameter using the smem command.
          I'm imagining a graph like the one below, what do you think?

          Note
          I am using ps command to get rss and vsz.
          I am using smim command to get pss, uss, rss.
          Obtain the number of problem events using the following SQL.

          select count(*) from problem where r_clock = 0 ;

          <vso > pss in your case looks good, VSZ should not be taken in consideration as it is not how much memory consumed but how much is available for consumption.

          Itsuki Karimata added a comment - - edited It is assumed to be obtained using userparameter using the smem command. I'm imagining a graph like the one below, what do you think? Note I am using ps command to get rss and vsz. I am using smim command to get pss, uss, rss. Obtain the number of problem events using the following SQL. select count(*) from problem where r_clock = 0 ; < vso > pss in your case looks good, VSZ should not be taken in consideration as it is not how much memory consumed but how much is available for consumption.

          Andris Zeila added a comment - - edited

          Released ZBX-25154 in:

          • pre-6.0.34rc1 39d318a8410, c812cf784fd, 1ebd1e3d059
          • pre-7.0.4rc1 9f6dab7360f, 31bf7397c6f, 9d14fdf9d92
          • pre-7.2.0alpha1 dc3d221e8d3, 24d98631c3a

          Andris Zeila added a comment - - edited Released ZBX-25154 in: pre-6.0.34rc1 39d318a8410, c812cf784fd, 1ebd1e3d059 pre-7.0.4rc1 9f6dab7360f, 31bf7397c6f, 9d14fdf9d92 pre-7.2.0alpha1 dc3d221e8d3, 24d98631c3a

          I don't think it's necessary anymore, but I've attached a graph showing the values ​​of pss, etc.
          Also, I accidentally stopped the OS twice on September 12th.

          • problem event count
          • smem
          • ps
          • Use Zabbix standard item key "proc.num"

          Itsuki Karimata added a comment - I don't think it's necessary anymore, but I've attached a graph showing the values ​​of pss, etc. Also, I accidentally stopped the OS twice on September 12th. problem event count smem ps Use Zabbix standard item key "proc.num"

          Updated documentation:

          Martins Valkovskis added a comment - Updated documentation: Upgrade notes: 6.0.34 , 7.0.4

            wiper Andris Zeila
            ikarimata Itsuki Karimata
            Team A
            Votes:
            1 Vote for this issue
            Watchers:
            8 Start watching this issue

              Created:
              Updated:
              Resolved:

                Estimated:
                Original Estimate - Not Specified
                Not Specified
                Remaining:
                Remaining Estimate - Not Specified
                Not Specified
                Logged:
                Time Spent - 4h
                4h